DataSwarm Predictive Analytics
DataSwarm builds systems to predict trends and forecast events. Our systems have been proven across many industries and applications from successful asset price forecasting to election prediction.
Dataswarm uses a variety of techniques including Statistical and Probability models, Simulation and Dynamic modelling and Machine Learning / AI
DataSwarm won an Award in the 2nd US Government’s IARPA Geopolitical Forecasting Challenge.
Learn more about IARPA “Superforecasting”

Cutting edge analytics of today driving the enterprises of tomorrow

What we do


Business – Consulting Services
Combining years of business experience and data analytics skills to analyse and predict individual company and sector performance.
Market Analysis
End to end analysis from market intelligence to customer service. Work ranges from global product-market fit analysis to churn reduction via service optimisation
System Building
We have built systems for Business, Media, Market and Customer Service monitoring, Financial asset trading and various Geopolitical prediction areas such as election and risk forecasting.
Areas of Expertise


Business
Worked with clients in a range of sectors including Media, FMCG, Internet/Tech, Finance.
Finance
DataSwarm Markets: Bringing near real time data analytics to investment analysis, asset price and performance prediction. Mk 1 systems December 2019 to November 2021 trading in US markets resulted in 63% vs. S&P 50% and low risk.
Geopolitics
Election Forecasting: Won IET Innovation award for successfully predicted Brexit result and Trump 2016 and a number of other elections against the prevailing consensus.
Geopolitical Forecasting: IARPA award for 300+ predictions over a wide variety of topics.

To make useful predictions you cannot just follow the Wisdom of the Crowds


How we do it (AI et al)
We are a “Real AI” company in that we use various Machine Learning and Deep Learning techniques. However, we also use Statistical, Probabilistic, Qualitative, Operations research, Event simulation and System dynamic approaches when appropriate and relevant.
Learn more about our technology or contact us

Tracking topics – analysing perceptions – predicting trends

How can we help you?
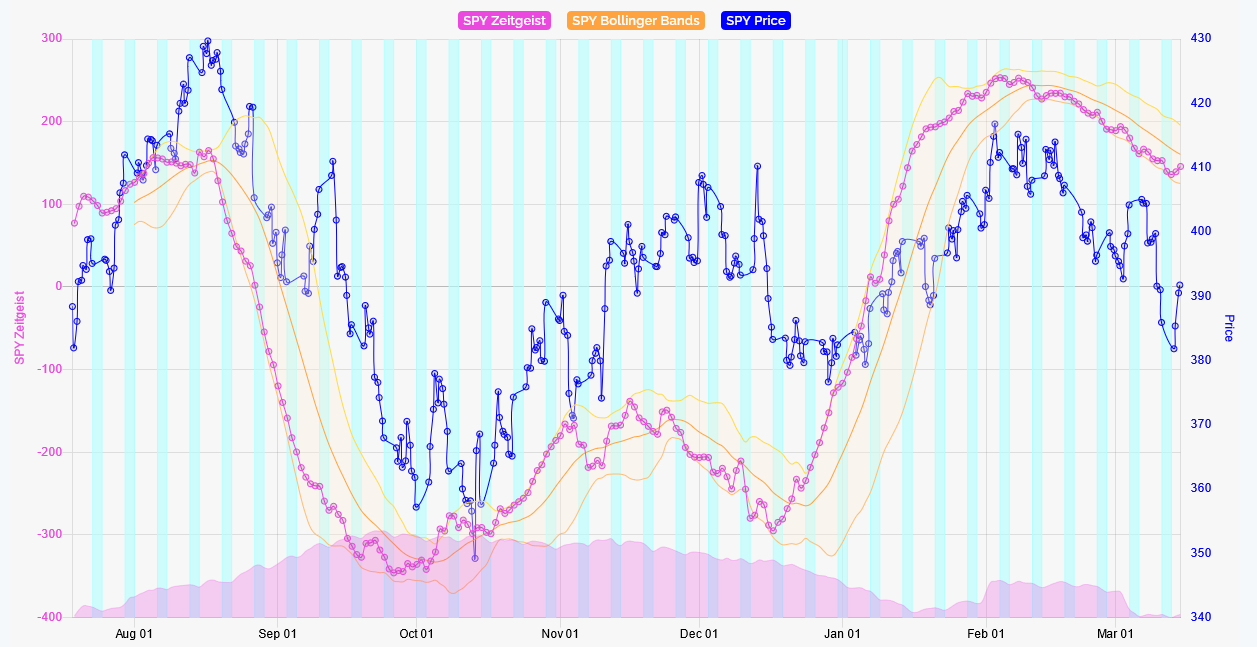
We build systems to track and predict trends, and forecast events. Our systems have been proven among many industries and applications. Clients can either take a system generated data feed (“Zeitgeist”) or use systems we build for them.
The image below shows an example, market trading using the Dataswarm Markets “Zeitgeist” signal to predict market movement.


“In forecasting, hindsight bias is the cardinal sin.”
– Philip Tetlock, author of Superforecasting

Visit Services for more details

DataSwarm Ltd
@dataswarm_
dataswarm.tech