Technology analyst and journalist Andrew Orlowski contacted us about an article he was writing in The Telegraph (article is here) about prediction techniques using social media. We thought it might be useful to add some more detail showing what can be done using social (and other) media to make predictions.
How it works
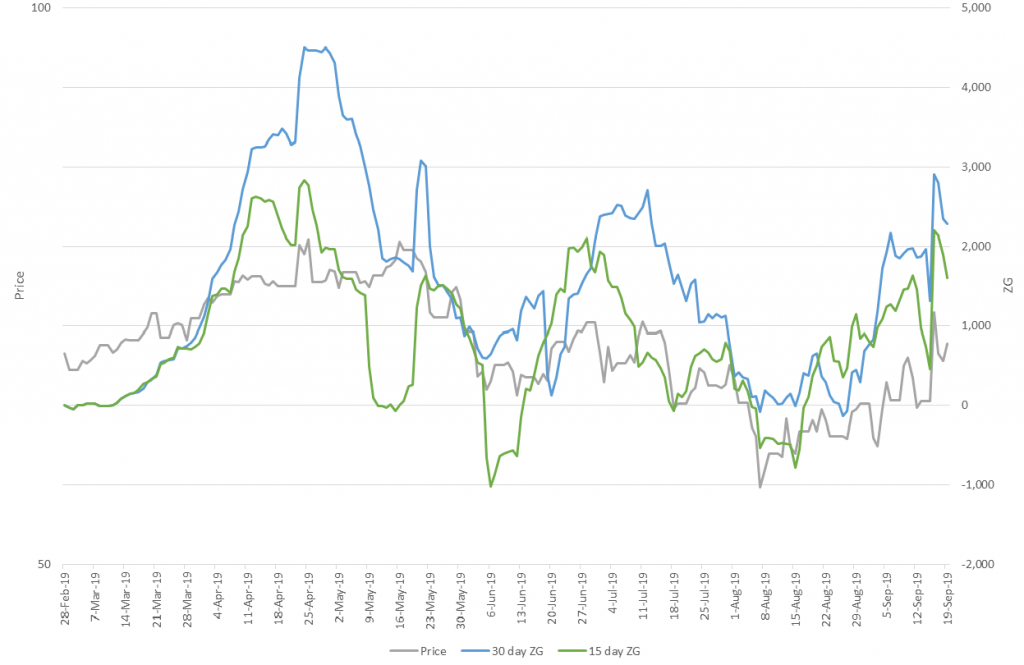
In essence social media is the “Wisdom of Crowds” writ large – listening to what people are saying gives a reasonable indication of what they are thinking, and will do. However, as Orlowski notes “One needs to look past the bots, the superfans, and the ‘superhaterz’…and discern what are the valuable signals, and the velocity at which they are moving”. We call this movement of the trend signal over time the Zeitgeist (ghost of the time). This is shown in the graphs above, tracking people’s views of the Brent crude oil price with a 15 and 30 day moving average Zeitgeist (ZG)
There is more to actually building an analytical system that is predictive of course, there is also quite a bit of maths and computer science involved. Other big errors arise from not understanding where the data comes from – it is people, not particles. Also, making sure the system output is tested and corroborated by backtesting is important.
One major issue to overcome with predictive systems is to remove biases, both in:
- The data – social media around an issue is often not a complete set of all views
- The observer – social media output is amoral, the main risk is that the user’s bias then colours the analysis. (I think this is a far wider problem than social media analytics, from Brexit to the Ukraine war we have seen predictions continually skewed by observers’ views)
Applications
We have used the system successfully across a wide range of applications, some are described below:
Commercial Applications
This sort of system can be used for a wide variation of uses, we have used it successfully in telecoms, different fast moving consumer goods types and media. Uses have been:
- Customer insight – mapping rising trends, comparing trends across markets, finding customer subgroups. It has been used in comparing customer base differences between countries for the same product to good effect for example.
- Sales – understanding what resonates with the various trends and subgroups mentioned above. It also allows estimation of price points for different customer groups
- Customer Service / Satisfaction – understanding what customers do and don’t like. The ability to break the user base into subgroup types with different sensitivities (e.g. time to respond vs convenience of response) is also very useful.
- Competitor tracking – one can use the techniques to listen to the competition to understand various strengths and weaknesses of each.
- This is also quite useful for long term fundamental analysis of companies to understand strategies and if there are emerging problems
Geopolitics – Election Prediction and more
We predicted Brexit and Trump (against the run of other prediction systems), and went on to predict a number of other elections in 2016-17 – and got them all right. The hardest for the system was the French election – not who would win, but the correct spread of votes – as there is only a 2 weeks gap between the first (all candidates) and second (final two candidates) rounds. A lot of the datapoints (i.e. voters) decide who they are prepared to vote (or not vote) for very late in the day.
IARPA Geopolitical “Superforecasting”
We learned a lot in the IARPA 2nd Geopolitical Forecasting Challenge (this is the “Superforecasting” challenge the UK Government was keen on in the Dominic Cummings days). We competed against c 40 other companies, universities and other organisations to predict over 300 different things over a range of timescales from 6 days to 6 months. We won one of the minor prizes, which we felt was a decent outcome for an approach and a system still in beta form.
The Challenge questions included the following major areas (and some examples of prediction questions in brackets):
- geopolitical (election results, likelihood of invasions/peace/riots, outcome of various events within and between countries)
- economic (prices of wheat in some part of the world, unemployment levels in various countries)
- industrial (likely change in competitive positions between countries in various areas, development of some technology)
- medical (health outcomes, disease outbreaks)
- climate issues (temperatures at a certain place and time, changes in metrics)
- financial (prices of various commodities, currency exchange rates, various indices and other asset prices at a point in time).
The system performance varied over these areas. In some cases it wasn’t really suited for various reasons but we found more often it could get results but was hamstrung either by:
- Not enough datapoints in the prediction time allotted, we would have needed to build up previous history or
- We hadn’t yet built a module that could process that particular area as well as could be done, so had to use a high level approach
It was also clear that social media analysis is stronger if it can be enhanced with other area specific datasets and approaches in any one topic.
Financial Assets – price prediction
During the IARPA Challenge we found our system was especially good at using social media analysis for the financial prediction problems and decided to build a system more specialized for this. After a very short period of adaption we started to test the system “live”, trading in the US stock markets when IARPA ended. We traded from December 2019 to November 2021 in this experiment. It survived the “Covid Crash well and achieved a 63% return at a risk rate of about half that of the major indices (S&P500, NASDAQ).
A big lesson from this is there is a lot you can do to improve performance if you focus the system on a specific area, but it starts to become specialized – there is a risk it can become over specialized (“over-fitted” in modeling jargon). We are taking what we learned in the trial and are now building the “Mk II” trading system.
In Conclusion
Always remember that you are looking at humans, and they are inconsistent. And always remember the biasses, eradicating them is hard! As Orlowski concluded “perhaps DataSwarm’s relative success is because unlike the utopians, it is prepared to [look at the dark side of humanity]…. You’re looking at the wisdom of crowds, or the stupidity of crowds”.
Or both, at the same time…..