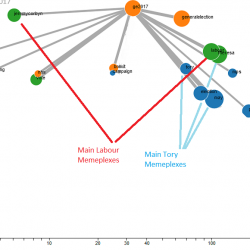
Diagram showing more Tory memes in the top right, the memetic “sweet spot” of relevance and influence, There is a far higher intersection between “Theresa” and “May” than between Hillary and Clinton, which reduces her memetic impact.
It’s the day before the UK general election, and our system is showing that on Twitter at any rate, despite Labour moving up, it is still predicting a Tory victory (we never saw the huge reported difference in support as the election began, and have just seen a slow closing of a smaller gap).
It will also be interesting to measure the actual splits vs predicted, the system is saying (via the algorithm we’ve found most reliable in the last 3 elections) that the Tories are c 15% (between 7 and 21% higher than Labour – in 2015 it was 37% vs 30% voter support, i.e. c 23% higher so our system is saying 2017 difference is slightly smaller). Note this is a prediction of % difference between the parties, not necessarily of the seats won, the UK “first past the post” system can skew the seats won vs actual vote % hugely. The algorithms overall straddles a tiny Corbyn win (those most sensitive to most recent movements) to a fairly large Tory one (those least so). (To clarify, it means our bottom bound is a Tory win but not an overall majority, to about the same as they have now)
For what its worth one of our algorithms is calling a 40% difference, and it got the closest to Macron’s eventual second round score – but it also had Clinton and Vote Remain winning.
But, this is more likely to be a low end estimate than a high one for a Tory win, as we know that: (Post Election update – there was about zero bias between the social media data and the actual outcome, it is now representative of the UK demos)
- The demographic that is not on social media, that does vote, and to be more likely to vote Tory
- “Shy Tories” – those people on social media who talk liberal but vote Tory are a few % of those polled.
- Historically, Tory voters are more likely to actually get out and vote
We don’t know the size of these extra factors though, but we’d “estimate” (aka guess from not much data available) that it is worth several % so we think the actual outcome may be Tories are between c 10 and 30% higher (ie if Labour has 30% of the vote Tories are between 33 and 39%)
Assuming that the % difference between the parties is a rough proxy for seats (a rather dangerous thing) it means the Tories will be around the same % difference as in 2015 or a bit better, so between a hung/very small and a relatively small majority (a few tens of seats at the most).
If we are wrong the probable reasons will probably be due to either of these:
- We have not yet tuned the algorithms to deal with Corbyn’s rise in popularity properly and have underestimated it. Where we have had the most variance from the various algorithms is where there has been a larger delta over the period measured. For example Hamon’s rapid drop in popularity threw our previous “best” algorithm off. Clinton’s rise at the end of the US election is similar (according to our system) to Corbyn’s rise here but in the US the margin of error between the two was far closer.
- We have overestimated the Labour bias on Social Media
- We have underestimated the size of the Tory non-social media demographic (and/or its higher probability of voting) and it is far bigger than we the single digit % we have allowed.
So, we await Friday morning with some interest, but also some trepidation (as to whether we are right or wrong…)
It was a hung parliament, the result was in our lower quartile. But even our upper bound was way below what the UK polling projections were, all were calling confidently for a Tory win.